Showing posts sorted by relevance for query affordable housing. Sort by date Show all posts

Tuesday, 8 October 2013

The market for affordable housing is still broken

Nick Smith Len BrownI was struck by the posturing last week of Nick Smith and Len Brown, slapping each other on the back out at Manurewa, both trying to take credit for a new “affordable housing” development at Weymouth.

If you read their press releases, these new “affordable homes” are supposed to be the harbinger, somehow, of “39,000 new homes built in the city over the next three years,” so “avoiding a repeat of the previous [present] runaway housing market [that] had been an ongoing concern of the Government.”

So they’re all ever hopeful. But there's no need for them to fight over the accolades—all of their colleagues can take credit for it. Because not only is this development “affordable housing” in name only, it shows in microcosm what’s making it hard to build affordable housing at all.

The devil is in their details.

Monday, 13 May 2013

Housing: Is smaller better, or even necessary?

The “housing accord” agreed to between the Auckland Council and the National Government’s Nick Smith is being talked of as a victory for National’s wish to extend the city out into green pastures over the Auckland Council’s wish to intensify existing built-up areas. (A phony dichotomy, as I’ve said before.)

Those seeing it as a defeat for the council bewail their lack of success in getting agreement on “quotas for affordable housing to be included in the accord.”

Let me here just focus on one grave misconception about what makes housing affordable, because Auckland’s planners apparently have no idea.

imageIn pushing for smaller, cheaper, cooky-cutter shoeboxes as their epitome of what affordable housing should look like, they’re doing a simple calculation while ignoring the reality of how a housing market actually works.1 Their calculation is done—need cheaper houses; therefore need fewer square metres per house; therefore mandate higher densities and smaller cooky-cutter shoeboxes.2

Little apartments, made of ticky tacky. Or “innovative techniques” used to build better shoeboxes.

But this ain’t necessarily so, and it ain’t necessarily so because it ignores the true dynamism of urban housing markets.

You see, in affordable, dynamic housing markets, most affordable housing coming onto the market is not new, smaller, cheaper housing—it’s superior-quality “second-hand” housing that is coming onto the market as a result of the vendor “moving up.”

This is important to understand, because building cheaper, smaller, shoeboxes simply means you’re building the slums of tomorrow.  Whereas building newer quality housing into which people “moving up” can move into—leaving their own house available and affordable for another buyer—over time increases the overall quality of the city’s housing stock. In other words, if you want quality affordable housing, then make it possible to build larger, quality, newer housing that appears on the face if it to be unaffordable.

This seemingly contradictory point can be understood only when you learn about this concept of “churn.”

“Churn” in this context refers, as I said, to the chain of purchasers who are all “trading up” after a new house is bought and folk move into that house and out of their old one—leaving their old house empty for someone else to move into, which leaves their house empty for someone else to move into, which leaves their house empty for someone else to move into, and so on and so on right on down the line.  This is “churn.”

In a healthy housing market, one house purchase by one family can start off a chain reaction of up to ten, twelve or even twenty moves further down the line as each family moves out of their old and up to their new home.

Why do I say “move up”? Because this is the housing equivalent of the weird double-thank-you moment we talk about in economics:

How many times have you paid $1 for a cup of coffee and after the clerk said, "thank you," you responded, "thank you"?
There’s a wealth of economic wisdom in the weird double thank-you moment. Why does it happen? Because you want the coffee more than the buck, and the store wants the buck more than the coffee. Both of you win.

And the proof that you win—that you both valued the exchange—is that each exchange happened voluntarily.

It doesn’t just work for coffee. Because when you decide to sell your current house to move into a new one (new to you), it’s because you want the newer place more than the old place—and your new buyer wants your old place more than their old place, and so on down the chain. You each want the new place because in your minds your new housing situation is going to be better for you than your existing housing situation.

It’s just the same for every buyer in the chain.

And the proof that you win—that you both valued the exchange—is that each exchange happened voluntarily. Increase the possibility of more exchanges like this taking place, and you increase the number of times people are able to improve their circumstances.

So every time a new house is built and purchased, of whatever value, that opens up opportunity for many other families to make their situation better.

So while the buyer of the affordable $300,000 house may not know it, but the construction of that that new $800,000 house could possibly be what just made his own life better. He’s at the end of a “chain of churn” created by that first purchaser and his vendor both saying “Thank you!”

This is what happens when the housing market is not broken by regulation, as it is now.

NewHome001Here’s something else that seems contradictory until you think it through a little: It turns out too that in a healthy housing market a new more expensive home creates more openings down the line than a cheaper more affordable home does—up to twenty housing moves for an upper-quartile home as compared to less than five or six for one in the lower price quartile--meaning, strangely enough, that the more expensive houses that are built the more folk actually benefit.3

Which means, if the housing market were less constrained than it is now, that  its entirely possible the buyer of the affordable $300,000 house has acquired his opportunity because of the construction of a new $1.8 million house!

If that idea makes your head hurt, then consider this question: is it better in general to build better houses or lesser houses? Wouldn’t we all agree that better quality is far better than lesser? So as better houses costing more are built and folk move up to what in their own view are better houses, more people are actually helped and the overall housing stock for everybody is improved.

NewHome002Isn’t this better than flooding the market with houses of lower cost and lesser quality, which actually produces fewer moves helping fewer people, and resulting in the end only in having created the slums of tomorrow?

The real answer to affordable housing then is still out there.

The answer is to fix the broken market.

And how do they do that?  They stop pretending either the council’s planners or the governments know what they're doing, and they both get the hell out of the way.

* * * * *

1. For those paying attention, this is yet another example of “the seen and the unseen.”  Newer “affordable” apartments mandated by quota would be seen—and seen as a direct result of the council’s quota. Cue photo opportunities all round.
Whereas the number of affordable opportunities opening up as a result of newer, more up-market housing being built, is largely unseen—and therefore mostly unavailable for politicians’ photo opportunities.

2. Yes, building costs also need to come down to make medium-cost spec building profitable again, because it’s speculative builders who until recently provided the bulk of the NZ housing stock, and who are now priced out of the medium-priced market. Until costs come down, the only place a spec builder can be sure of his margins is in the market for higher-priced housing, where prices are high enough to cover the rapidly stampeding building costs.

2. Of course, in a healthy market, housing prices don’t bubble up like New Zealand’s have in recent years.

imageGraph from Rodney Dickens’s report “Quantifying the Housing Affordability Time-Bomb”

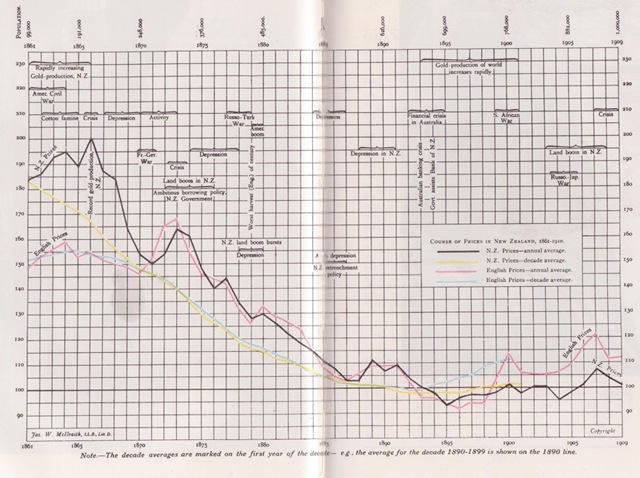
Instead, they decline gently, just as all commodities do in healthy markets enjoying stable, un-inflated currencies.  Just like New Zealand & Britain were in the late 1800s…

“Course of Prices in New Zealand, 1860-1910,” from Muriel Prichard’s book ‘An Economic History of New Zealand’

Monday, 1 October 2012

New Zealanders are getting “screwed” on housing

_hugh-pavletich-smlIt is hoped there will be a major government announcement on housing supply by the end of October. Hugh Pavletich says the Roost Home Loan Affordability Report released Friday demonstrates why a major announcement, and a major govt rethink, is urgently needed.

NEW ZEALANDERS ARE GETTING “screwed” on housing. Let’s compare  Christchurch and Auckland with, let’s say, the housing markets of Houston, Dallas, Fort Worth,and Atlanta--using a simple "mixed measure" reflecting the cost of money and housing, current interest rates, and median house prices and gross annual median household incomes; in other words, the methodology employed by Demographia, the World Bank, United Nations and Harvard University.

What we find is astonishing, especially when correlated with the level of regulations on land.

image

By this measure, with a multiple of 6.4, Auckland is the tenth-least affordable large metropolitan market in the English-speaking world.

This is not the sort of prize we want to win.

Not appearing on this chart because it’s not large enough, poor destroyed Christchurch is however not far behind, with a house price/income multiple of 6.3. Houston(1) however has a multiple of just 2.9; Fort Worth and Atlanta and 2.8 and 1.9 respectively.

Readers may like to check out the listings and latest Monthly Report of the Houston Assn of Realtors to get a sense of what a normal affordable housing market looks like. Our major markets in contrast are severely unaffordable....and therefore abnormal.

They may like to ponder why the Houston economy grew by 8.5% last year and is expected to do so again this year... perhaps because without spending so much on their houses there are more savings available for business.

They might also like to learn about those American cities where the paycheck stretches furthest, and why their disposable household incomes look so pretty.(2)

Tuesday, 4 October 2016

The record shows that to make more affordable housing that’s affordable, it’s better to build more OUT rather than up


The mandarins who have made Auckland housing unaffordable have decreed in their new Unitary Plan that the city shall grow up, not out, and other NZ cities are following suit.
    The same decree has just gone forth from Obama’s White House – instead of relaxing artificial constraints on horizontal development, the decree advocates even
tighter constraints to force even denser housing in American cities.
    But the fact remains, explains Randal O’Toole in this guest post, that no matter how often urban planners chant, “grow up, not out,” the fact is that no urban area anywhere has ever made housing more affordable by increasing its density.

A new Housing Policy Toolkit from the White House admits that “local barriers to housing development have intensified,” which “has reduced the ability of many housing markets to respond to growing demand.” The toolkit, however, advocates tearing down only some of the barriers, and not necessarily the ones that will work to make housing more affordable.Randal1

“[Cities in the American sunbelt] with more permeable boundaries have enjoyed outsized growth by allowing sprawl to meet their need for adequate housing supply,” says the toolkit. “Space constrained cities can achieve similar gains, however, by building up with infill.” Yet this ignores the fact that there are no cities in America that are “space constrained” except as a result of government constraints. Even cities in Hawaii and tiny Rhode Island have plenty of space around them–except that government planners and regulators won’t let that space be developed.

Instead of relaxing artificial constraints on horizontal development, the toolkit advocates imposing even tighter constraints on existing development in order to force denser housing. The tools the paper supports include taxing vacant land at high rates in order to force development; “enacting high-density and multifamily zoning,” meaning minimum density zoning; using density bonuses; and allowing accessory dwelling units.[All of these things are part of Auckland’s Unitary Plan, or are promised by several of the leading mayoral candidates – Ed.]  All of these things serve to increase the density of existing neighborhoods, which increases congestion and–if new infrastructure must be built to serve the increased density–urban-service costs.

Urban areas with regional growth constraints suffered a housing bubble in the
mid-2000s and are seeing housing prices rise again, making housing unaffordable.
Source:Federal Housing Finance Agency home price index, all transactions.

Developers learned more than a century ago that people will pay a premium to know that the neighbourhood they live in will not get denser. Even before zoning, developers used restrictive covenants to limit density because they knew people would pay higher prices for lots with such covenants. When zoning was introduced to do the same thing, many neighbourhoods were built without such covenants, but that doesn’t mean the people in those neighbourhoods will be happy to see four- and five-story buildings pop up among their single-family homes.

Urban areas with few regional growth constraints see only moderate changes
in housing prices over time and still have plenty of affordable housing.

Planners argue the market has changed and more people want denser development. This is belied by the toolkit, which also supports the use of property-tax abatements and value capture incentives (i.e., tax-increment financing) to promote higher densities. If there really were a market for higher densities, such subsidies would not be necessary.RAndal2_thumb[2]

If there really is a market for higher densities, then developers should be allowed to build such densities in areas that are not already established low-density neighborhoods. But developers should also be allowed to build low-density neighborhoods at the urban fringe to meet the demand for that kind of development. Instead, state and local planning rules in California, Florida, Hawaii, Oregon, Washington, and most New England states have essentially made such low-density developments illegal.

Moreover, there is little reason to believe that “building up with infill” will make cities more affordable. Artificial constraints on urban growth make land many times more expensive than in unconstrained areas. Mid-rise and high-rise housing costs more to build per square foot than low-rise housing.

Increasing density generally correlates with decreasing housing affordability.
Source: 2010 US census.

No matter how often urban planners chant, “grow up, not out,” the fact is that no urban area in the nation has ever made housing more affordable by increasing its density. In fact, as the chart above shows, there is a clear correlation between density and housing unaffordability.

The urban areas that have been increasing their densities through artificial growth constraints are precisely the ones that are having affordability problems. For example, from 1970 to 2010 the density of the San Francisco-Oakland urban area grew by 43 percent while its median home value-to-median family income ratio (a standard measure of housing affordability) grew from 2.2 to 7.1. Portland’s density grew by 14 percent and its value-to-income ratio grew from 1.6 to 3.9. Honolulu’s density grew by 23 percent and its value-to-income ratio grew from 3.2 to 6.6. Growing up has made these regions less affordable, not more.

Ultimately, what is wrong with the White House toolkit is that it is focused on local zoning which it should be focused on urban growth constraints. If there are no urban growth constraints, local zoning won’t make housing more expensive because developers can always build in unrestricted areas. Dallas has zoning; Houston doesn’t, yet in 2014 both had house price-to-income ratios of 2.4. Only regional growth constraints make housing expensive. Every major city in America except Houston has local zoning, yet only those cities that have growth constraints have become unaffordable.

The increased regulation advocated by the White House will make those areas less affordable, not more, while it won’t do anything at all for areas that already have lots of growth constraints.

The White House toolkit calls its proposals “smart housing regulation.” [So too do Auckland planners decribe their Unitary Plan – Ed.] Truly smart regulation would rely on policies that work, not policies that only work in the fantasies of urban planners. The policies that do work would better be described as “smart land-use deregulation,” as they involve dramatically reducing constraints in unincorporated areas. Until that happens, housing will continue to become less affordable in constrained areas.


rotoole_thumb[4]Randal O’Toole is a Cato Institute Senior Fellow working on urban growth, public land, and transportation issues.
This post first appeared at Cato.

.

Monday, 23 January 2017

Auckland world’s fourth-hardest place to buy a house


Yes friends, the bad news for all those living anywhere between Pokeno and Wellsford (or wanting to) is that the Auckland housing market is now the fourth-most unaffordable in all the places in the world that are measured by the study out this morning. Which is a lot. And Tauranga – Tauranga, with ample land around it on which to spread! -- is not far behind.

Frightening!

What the new study by Demographia confirms is that (as measured by comparing the median house price in a city to the median salary enjoyed by that city’s residents), Aucklanders have the fourth-most expensive city in which to buy a house in all off Australasia, Canada, China & Hong Kong, Ireland, Japan, New Zealand, Singapore, the United Kingdom and the United States (I told you they measure a lot of places).

So that makes Auckland a more expensive place to buy a house, by this median multiple, than every city in this measured world apart from Hong Kong, Sydney and Vancouver. More expensive than Tokyo. More expensive than New York, Osaka-Kobe-Kyoto, and Los Angeles. More expensive than London!

In Auckland, the median multiple (the ratio of the city’s median house price to its median salary) is now 10.0. In London, it is 8.5.

In a normal housing market, in which supply is not constrained unnecessarily, that median multiple is around 3.0 – as it was for most of Auckland’s history until now, and as it still is in very liveable and relatively unconstrained cities in the US like Rochester, Buffalo, Cincinnati, Cleveland, Pittsburgh, Oklahoma City, St. Louis, Grand Rapids, Indianapolis and Kansas City (whose median multiples range from 2.5 to 3.0)

And Auckland continues to grow more unaffordable, not less, every year this study has been performed.

No wonder ACT’s David Seymour has broken ranks with his National partners, saying (accurately) that “the government's housing policy will go down as one of the most cynical pieces of politics in New Zealand's history.”

Here is the full press release and executive summary by the survey’s authors:

PRESS RELEASE:

New Zealand’s housing consensus:
Where is the political leadership ?
Hugh Pavletich, co-author Demographia International Housing Affordability Survey

The 1st Annual Demographia International Housing Affordabilty Survey was released early 2005.

These annual surveys, as Oliver Hartwich of The New Zealand Initiative within the Introduction to this year's edition makes clear, have proven to be an essential foundation for constructive public discussion of these issues.

By early 2007, the then New Zealand Opposition National Party, under the leadership of the young John Key, started to ‘use’ the housing issue to pressure the then Labour Government in the lead-up to the late 2008 election.

The Key-led National Party won.

Mr Key was extremely clear from 2007 through to the election late 2008, as this interview and  speeches at the time illustrate.

Sadly … post- election …the ambitious action man became the can kicker.

In advocacy terms however, the ‘tipping point’ was the October 2012 Government response to housing affordability report  ( video - media presentation ), led by then Finance Minister (now Prime Minister) Bill English … with the focus on –

  • land supply,
  • infrastructure financing,
  • process and
  • construction costs.

The performance since that time … now over four years ago … could most charitably be described as woeful.

The incompetence of a supposedly centre-right government has been extremely disappointing.

Mr Key had long been disruptive to progress on these issues ... again, as this writer made clear soon after the major October 2012 announcement with … Housing: Mr Key – Get on the Programme .

Since the October 2012 announcement, for example, Auckland housing has further inflated from about 6.7 times household income to 10.

Auckland’s median house price was $427,500 when Mr Key’s Government came to office late 2008 (refer 2009 5th Annual Demographia International Housing Affordability Survey ).

If prices had even been held at this level … with a sound mix of land releases and progressive bond financing of infrastructure … and with Auckland’s current median household income of $83,000, Auckland’s median multiple today would be 5.1 not the current 10.

Median house prices are currently way out of control at around $830,000.

Better still … if prices had been allowed to gently ease since late 2008 (as polling has illustrated most New Zealanders prefer … and currently getting underway in Greater Christchurch, led by easing rentals), then Auckland today would be well on the road to restoring housing affordability.

Auckland’s house prices would now be around 4 times household incomes, not the egregious 10 times incomes they are.

The median house price would be about $330,000 … not the current stratospheric and grossly irresponsible $830,000 !

Political failure of epic proportions !

Thankfully however ... there is now a very broad consensus across the political spectrum.

This is thanks to New Zealand being a dynamic democracy with an engaged and responsible media … as illustrated within the extensive postings within ‘Three Years On … The Great Consensus Emerges’ and the ‘2016’ sections of this writers archival website Performance Urban Planning .

This broad consensus is remarkable. A world first.

By May 2016, polling by Newshub/Reid Research  found an unprecedented 76% of the public dissatisfied with the Governments management of the housing crisis.

What had been a housing crisis worsened to become a political crisis as well.

I predicted late August housing would be Mr Key’s Waterloo.

Also during late August, Mr Key had an unfortunate  interview with Mark Sainsbury at Newshub. 

Labour’s Housing Spokesperson Phil Twyford followed, speaking competently with conviction.

Mr Twyford’s comments reminded one of Labour’s proud history on housing … Restoring the housing that Jack (and Norm) built ... Oliver Chan ... Spinoff.

Late November, the Labour Party leader Andrew Little spoke to the Property Council.

Housing concerns featured very prominently within the September New Zealand Herald’s Mood of the Boardroom 2016 .

Business leaders had lost confidence in Mr Key.  And even more so, his Housing Minister Dr Nick Smith.

Mid 2016 Nick Smith welcomed the Labour Party's call to abolish city limits.

Astonishingly, he has made no attempt whatsoever to reach out to other political parties to form a broad coalition on these issues.

The broad consensus is there. The only obstacles are political incompetence and inertia. 

In contrast, Labour’s Housing Spokesperson Phil Twyford, with his colleague David Parker,  are reaching out to other political parties, as happened with the Housing Accords Extension legislation earlier September … and on other occasions.

In private during September and with an election required by the end of 2017, Mr Key made the decision he was going to exit politics.

He had no intention of facing the music in 2017.

Within the meandering Media Conference on the date of his resignation … Monday 5 December … no mention was made of the housing crisis.

Remarkably, the journalists present failed to ask Mr Key … why ?

2017 is election year, with housing the Number One issue yet again as this pre – Christmas poll result made crystal clear.

Voters will decide who is capable of getting the essential changes in place … an exercise in sorting out the performers from the pretenders .

ENDS


EXECUTIVE SUMMARY:

13th Annual Demographia International Housing Affordability Survey

How does your city rate?

The 2017 13th Annual Edition …

The 13th Annual Demographia International Housing Affordability Survey covers 406 metropolitan housing markets (metropolitan areas) in nine countries (Australia, Canada, China, Ireland, Japan, New Zealand, Singapore, the United Kingdom and the United States).  A total of 92 major metropolitan markets (housing markets) --- with more than 1,000,000 population --- are included, including five megacities (Tokyo-Yokohama, New York, Osaka-Kobe-Kyoto, Los Angeles, and London).

Rating Middle-Income Housing Affordability

The Demographia International Housing Affordability Survey rates middle-income housing affordability using the “Median Multiple,” which is the median house price divided by the median household income. The Median Multiple is widely used for evaluating urban markets, and has been recommended by the World Bank and the United Nations and is used by the Joint Center for Housing Studies, Harvard University. The Median Multiple and other price-to-income multiples (housing affordability multiples) are used to compare housing affordability between markets by the Organization for Economic Cooperation and Development, the International Monetary Fund, The Economist, and other organisations.

Historically, liberally regulated markets have exhibited median house prices that are three times or less that of median household incomes, for a Median Multiple of 3.0 or less.

Demographia uses the following housing affordability ratings (Table ES-1).

Housing1

Housing Affordability in 2016

There are 11 affordable major housing markets, all in the United States. There are 29 severely unaffordable major housing markets, including all in Australia (5), New Zealand (1) and China (1). There are 13 severely unaffordable major markets in the United States, out of 54. Seven of the United Kingdom’s 21 major markets are severely unaffordable and two of Canada’s six.

The most affordable major housing markets in 2015 were in the United States, which had a moderately unaffordable Median Multiple of 3.9, followed by Japan (4.1), the United Kingdom (4.5), Canada (4.7), Ireland (4.7) and Singapore (4.8).  Overall, the major housing markets of Australia (6.6), New Zealand (10.0) and China (18.1) were severely unaffordable.(Table ES-2).

There are 11 affordable major housing markets in 2016, all in the United States. Rochester was the most affordable, with a Median Multiple of 2.5, followed by Buffalo (2.6), Cincinnati (2.7), Cleveland (2.7), Pittsburgh (2.7), Oklahoma City (2.9), St. Louis (2.9) and four at 3.0, Detroit, Grand Rapids, Indianapolis and Kansas City.

There are 26 severely unaffordable major housing markets in 2016. Again, Hong Kong is the least affordable, with a Median Multiple of 18.1, down from 19.0 last year. Sydney is again second, at 12.2 (the same Median Multiple as last year). Vancouver is third least affordable, at 11.8, where house prices rose the equivalent of a full year’s household income in only a year. Auckland is fourth least affordable, at 10.0 and San Jose has a Median Multiple of 9.6.

The least affordable 10 also includes Melbourne (9.5), Honolulu (9.4), Los Angeles (9.3), where house prices rose the equivalent of 14 months in household income in only 12 months. San Francisco has a Median Multiple of 9.2 and Bournemouth & Dorsett is 8.9.

San Diego has a Median Multiple of 8.6 and London 8.5, the same as last year. Toronto has a Median Multiple of 7.7, like Vancouver, showing a year-on-year house price increase equal to a year of household income.

housing2

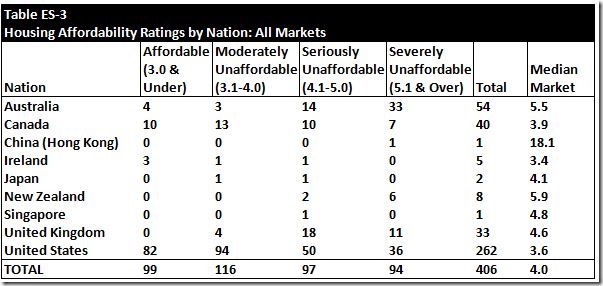
There are 99 affordable housing markets of all sizes including 82 in the United States, 10 in Canada, 4 in Australia and 3 in Ireland (Table ES-3). The most affordable market is Racine (WI) in the United States, with a Median Multiple of 1.8.

There are 94 severely unaffordable markets, with 36 (of 262) in the United States, 33 (of 54) in Australia, 11 (of 33) in the United Kingdom, 7 (of 40) in Canada, 6 (of 8) in New Zealand and the one market in China. Singapore, Japan and Ireland had no severely unaffordable housing markets. 

The least affordable among the smaller markets is Santa Cruz (CA) in the United States, with a Median Multiple of 11.6.
Housing3

“Best Cities” for Middle-Income Households

Every year, “best cities” and “most liveable cities” lists are produced by various organisations. Aimed at the high end of the market, these surveys virtually never evaluate housing affordability. Yet, the media often mischaracterises the findings as relevant to the majority of households.

In fact, a city cannot be liveable, nor can it be a best city to households that cannot afford to live there. Households need adequate housing.

The “best cities” for housing affordability are often better on middle-income urban outcomes that the high-end best cities that attract media attention. This is illustrated by a comparison between Dallas-Fort Worth, where housing affordability is far better than in Toronto, which was rated as the “best city” by The Economist. In addition to better housing affordability, traffic congestion was better and incomes were higher. This is despite the fact that Toronto employs the most favoured urban strategies, which Dallas-Fort Worth does not.

Another comparison shows that Kansas City has better middle-income outcomes that all of The Economist’s top 10 (for which data was available) in housing affordability and traffic congestion and higher incomes than all but three.

Excessive housing regulation has been identified as having significantly reduced economic growth in the United States and inequality internationally. It has complicated the inflation controlling role of central reserve banks.

Economic uncertainty is a substantial concern for households. It is important to keep housing affordable, so that households can live a better standard of living and greater poverty can be avoided. This requires avoiding urban planning policies associated with artificially raising house prices, specifically urban containment. Failing that, housing affordability is likely to worse further.

Paul Cheshire, Max Nathan and Henry Overman of the London School of Economics recently suggested that “… that the ultimate objective of urban policy is to improve outcomes for people rather than places” and that “… improving places is a means to an end, rather than an end in itself.”

Following that policy prescription, a number of cities (such as Dallas-Fort Worth, Kansas City) have achieved the objective of placing people over place For most of society, middle-income households, as well as lower income households, the best cities are where government authorities have overseen local housing markets competently, evidenced by housing that is affordable, all else equal.

The perspective of the Demographia International Housing Affordability Survey is that domestic public policy should, first and foremost be focused on improving the standard of living and reducing poverty.

Survey Introduction

The Introduction to this year’s Survey is by Dr Oliver Hartwich, Executive Director of The New Zealand Initiative, a public policy research organisation based in Wellington. Dr Hartwich has had a long association with the co-authors of this Survey, since his time with Policy Exchange in the United Kingdom.

Wendell Cox, www.demographia.com


Handy Index:

MAJOR MARKETS … RANKINGS: http://www.demographia.com/dhi13-s1.pdf

MAJOR MARKETS … ALPHABETICAL: http://www.demographia.com/dhi13-s2.pdf

ALL MARKETS … RANKINGS: http://www.demographia.com/dhi13-s3.pdf

ALL MARKETS --- ALPHABETICAL: http://www.demographia.com/dhi13-s4.pdf


.

Thursday, 6 December 2007

Maryan Street: Making housing unaffordability worse

Another day, another move by government to make life worse.

After years of deliberating over what, if anything, to do about rapidly increasing land costs, compliance costs and the unaffordability of housing (in major NZ cities it's now officially seriously unaffordable) former housing minister Chris Carter demonstrated back in May that he wasn't just illiterate when writing emails, but he was also economically illiterate.

His solution to the affordability problems caused by earlier regulations making housing seriously unaffordable was to be new regulation forcing developers to build affordable homes on land made unaffordable by earlier regulations. Brilliant!

Before handing over the reins of his ministry to Maryan Street, he prepared a bill along those lines which she is now peddling with even less understanding of the issues that cause housing unaffordability than Carter had. It deals with the serious problems that are causing rising house prices by making things worse for those building houses; by insisting that developers who are already hamstrung by rising costs simply be forced to build cheaper houses, and on land often worth far more than the houses they'll be forced to build.

King Canute could have done no better.

The bill purports to foster a method by which more affordable housing can be built: it does so by making life impossible for the builders and developers who will deliver them.

On top of all the regulatory hurdles already in place for those building new homes, this bill adds one more: the decree that developers, whose margins are increasingly slim, will have to add so-called 'affordable housing' to their developments -- low-cost housing on high-cost land; land made more expensive by the meddling of planners -- leaving any profits to be made from these homes to the purchasers who subsequently onsell them (which may happen relatively quickly). As I said when this nonsense was first proposed:
This will not result in an increase in affordable housing: it will result instead in developers' margins becoming even slimmer, and their ranks as a consequence becoming even fewer. Fewer developers with ever-slimmer margins will do nothing to decrease galloping demand, but it will help to even further decrease supply (and to demonstrate once again that the laws of economics are not be be repealed even by the decrees of a minister).

Carter has learned nothing from Canute, or from history -- or from the Law of Unintended Consequences. The history of government controls is like the story of the Emperor's New Clothes in reverse: New controls are added all the time in order to fix the problems caused by previous controls, but no one is listening to the little boy who is saying, "Why not just take off the controls altogether, and then you won't need to make up new ones." Why not just get governments both central and local the hell out of the way altogether?

Ever-increasing and ever-higher interest rates designed to squelch booming housing prices; the mortgage levy; the de facto cartelisation of NZ's 'big five' banks; now a decree that more affordable homes be built ... all measures desperately calculated to fix the symptoms of exploding housing costs while ignoring the regulatory causes.
As long as the regulatory causes of galloping unaffordability are ignored, unaffordability will continue to increase, and the working lives of builders, designers and developers made more onerous. But don't just believe me. The same scheme has been a disaster in all the countries in which it's been introduced, from Ireland to Britain to Canada to the US. The US figures (described by Owen McShane) are representative:
Over a ten year period, in US markets where the mandates had been applied, supply reduced, on average, by ten percent and house prices increased, on average, by twenty percent. This does nothing to make housing more affordable and indeed only makes things worse. Also, the restraints on resale actually made those "lucky" enough to acquire a "below market" house ended up much worse off than the rest of the population.
McShane's comments are backed up by research presented at a recent conference in San Jose. Economists Tom Means, Edward Stringham, and Edward Lopez presented Below Market Housing Mandates as Takings: Measuring their Impact a draft chapter from a book on "takings." The three economists have updated their 2004 findings and present more rigorous and detailed statistical analysis. "Their conclusions," says McShane, "should kill off any thoughts of forcing developers to provide a percentage of below market priced housing in return for development consents." These three University economists conclude:
Over a ten-year period, cities that impose a below-market housing mandate on average end up with 10 percent fewer homes and 20 percent higher prices. These results are highly significant. The assertion by the Court in "Home Builders Association v. Napa" that “the ordinance will necessarily increase the supply of affordable housing” is simply untrue.
Don Brash, now Chairman of McShane's Centre for Resource Management Studies, supports these findings, saying
We have been warned, and before any government forces New Zealand home builders and land developers to provide houses at below market prices someone will need to demonstrate why these findings regarding supply and price will not apply in the housing markets of New Zealand.

That will be a difficult task because both papers are based on the simplest and most firmly established economic principles linking supply, price and demand."
We know that Labour cabinet ministers have no interest in repealing law. I wonder then why they think they are able to repeal the laws of supply and demand and price?

Tuesday, 12 July 2016

#HousingCrisis | Zoning for special interests [updated]


In not being able to pay its own way, Labour's cure for affordable houses is unaffordable -- and in planning to confiscate private property both National and Labour plans are immoral. Yet even in their intentions (and politicians actions are judged not on results, but only on intentions) then even then, neither party are actually proposing producing houses that are actually affordable.

Affordable houses are generally considered to be houses with an average selling price of only 3 times average income for that area (a house price-to-income ratio met by Auckland as recently as the early 1990s).* Labour’s stated aim is to produce houses of around $500,000 to $600,000 – and National’s plan lacks even that paltry ambition. Yet at that price, that would still make a house price-to-income ratio of around 5 or 6.

So Labour’s seriously unaffordable plan is to make houses that are severely unaffordable.

Unaffordable
Table from 12th Annual Demographia International Housing Affordability Survey: 2016

Nice.

And meanwhile, the current state of the law ensures that the housing crisis will continue.

It’s like neither party actually has any genuine solutions to the crisis their laws have caused. Yet the answers have been known for decades.

HCrisisI refer you again to a simple book that’s been on my shelf for well over thirty years. Its solutions are comprehensive – one simple solution being to outlaw zoning --

If … there were no zoning or land-use control laws, there would be considerably more housing at considerably lower prices and in areas considered more desirable.

Both common law and the systems set up in un-zoned cities like Houston protect freedom and property owners far better than zoning, which has only been imposed for a few decades. The problems are evident, the solutions are known, yet zoning of every New Zealand city continues.

Men are born free but nearly everywhere in zones. Why? Because (as my well-annotated copy told me so long ago) so many cronies benefit from it.

Housing4
          Housing3

These are just a few of the interest groups who benefit from zoning – to them these days we might add the councillors and politicians whose campaigns are part-funded by the beneficiaries, the bankers who get to lend in an over-priced market, the increasing sea of well-remunerated resource consultants (who will become even richer come the dawn of Auckland’s new Unitary Plan), the older owners of rapidly inflating inner-city property, and the circle of land-owners around the outer ring of NZ’s cities awaiting and lobbying for re-zoning; all of them  making hay out of other people’s misery.

Nice.

But it doesn’t need to continue …

NOTES:

* “The Median Multiple (this house price-to-income ratio) is widely used for evaluating urban markets, and has been recommended by the World Bank and the United Nations, and is used by the Joint Center for Housing Studies, Harvard University. Similar house price-to-income ratios (housing affordability multiples) are used to compare housing affordability between markets by the Organization for Economic Cooperation and Development, the International Monetary Fund, international credit rating services, media outlets (such as The Economist) and others.” [Source: 12th Annual Demographia International Housing Affordability Survey: 2016, p. 6]

RELATED POSTS:

  • “The winners in this equation are those who already own property in the inner suburbs, mostly older generations. Restrictive land-use regulations have severely constrained the supply of housing in most Australasian cities, pushing prices up.
        “It is, in effect, a massive wealth transfer from the young to the old.”
    'Regulations that limit the stock of housing suitable for younger people, such as height restrictions and view shafts, need to be axed and pronto' – Jason Krupp & Alex Voutratzis, INTEREST.CO.NZ
  • The Coming to the Nuisance Doctrine is the only objective means of determining who has the right to continue using his property in the event of a nuisance. If zoning is to be replaced, therefore, it must be replaced with the Coming to the Nuisance doctrine.”
    The "Coming to the Nuisance" doctrine: The antidote to zoning – CAPMAG
  • “’When the productive have to ask permission from the unproductive in order to produce,’ said Ayn Rand, ‘then you may know that your culture is doomed.’ That’s true. Just ask anyone who has waited in line for a resource consent.”
    What would 'Party X' do about [affordable housing]? - PART 3: Small Consents – NOT PC
  • “Here is how the housing market works under John Key’s crony capitalism: he and his housing minister and the council’s planners have between them just made around half-a-dozen land-owners around Auckland rich beyond their wildest dreams.
        “Announcing out of the blue some land allowed to selectively slip through the council’s zoning net, the land-owners quickly discovered their land formerly zoned rural by planners now had the politicians’ and planners’ tick to build houses – and the value of said land immediately went through the roof.”
    Windfall profits for some at the expense of affordable housing for others – NOT PC, 2014
  • “Is zoning and urban planning racist? Are environmentalists guilty of racial injustice? Are planners the new segregationists? Yes, says Randal O'Toole of the Thoreau Institute.”
    Zoning and 'Smart Growth': The New Segregation? – NOT PC, 2006
  • “Here's a lesson that town planning advocates everywhere should note.  While most of the American housing market has experienced boom and bust in the face of expansionary Federal Reserve policies, housing in Houston has remained relatively immune -- even though it's been at the epicentre of rapid economic growth due to the commodities boom.
        The reason?  While most of the western world is under the thumb of town planners, with the result that housing in much of the western world has become seriously unaffordable, the city of Houston remains unzoned, and its housing among the most affordable anywhere.”
    Why Houston housing has avoided boom and bust – NOT PC, 2008
  • “Kip's Law:  "Every advocate of central planning always — always — envisions himself as the central planner.”
    “Planning” to stop Aucklanders plan – NOT PC, 2011
  • “What do town planners mean when they talk about things like ‘affordable housing’ and ‘community’?
    What they don’t mean is making houses affordable, or about any ‘community’ other than their own.
    The weasel words of “planning” power-lust – NOT PC, 2010

Monday, 9 July 2012

GUEST POST: Cut-price sections for #EQNZ red-zone residents

"Cut-price" sections are being released in Christchurch for residents of red zones. Where in Christchurch? Rolleston. How many sections? Eighteen. What price is cut-price? $113,000 to $139,000. Still, let’s not be churlish.

Hugh Pavletich of Cantabrians Unite responds:

_hugh-pavletich-smlTHE TEAM INVOLVED WITH the Canterbury Cooperative Land Trust is to be applauded for bringing sections to market for Red-Zoners in Rolleston for between $113,000 to $139,000. This is is not as good as things could be, but it is an extremely helpful step in the right direction.

There is still massive scope to lower prices further, but only when the serious structural and infrastructure issues in Christchurch are effectively dealt with by the Authorities at both central and local level.

Back in early 2010, well before the earthquakes, I set out the whopping differences of new-home costs between an affordable North American housing market  such as Houston, where housing costs 2.9 times household incomes, and, Christchurch—where the multiple between housing and income is a "severely unaffordable" 6.3.

There’s a a huge difference in building costs. On the fringes of the affordable US housing markets, starter-housing stock has an ALL UP build price of around $US600 per square metre. Compare that to here in Christchurch, where we enjoy a staggering build-cost of $NZ2,500 per square metre  and beyond.

Our residential development / construction sector is a shambles.

In her lead article this week’s Listener, Rebecca Macfie illustrates just how woeful our residential development & construction costs are in comparison with those in Australia. Yet Australia is not even in the same ballpark for cost efficiency as the United States.

TO OFFER RED-ZONE RESIDENTS sections at the $113,000 to $139,000 quoted in The Press, the Canterbury Cooperative Land Trust has taken the approach of attempting to wipe out developer margins—while no doubt allowing within this pricing a risk/costs overrun contingency. No doubt there will be further "savings" to end purchasers if, in the final wash, costs are controlled and the contingency is not required.

The Trust is being somewhat generous in suggesting the savings are quite as much as 40%. After all, this is South Rolleston. Lets just call it novice developer enthusiasm! In having said that, all involved (for little if any personal financial reward in most cases) are playing a hugely important role: first, in bringing better priced sections to market; and second, in illustrating to the wider public just how this is possible.

This is, however, a “one-off” deal. The major impediments to allowing affordable sections at and below $50,000 are not addressed at all by the Trust’s initiative: first,  the urgent need to eliminate the artificial fringe scarcity values created by planners strangling land supply; and second, the need to finance new infrastructure appropriately. (These points were covered in more detail in my article "Christchurch: The way forward.")

IT’S NOT ROCKET SCIENCE. New housing construction internationally today is a very formulaic business, and has been ever since the creation of the modern production construction industry by Bill and Alfred Levitt following World War Two.  Professor Peter Bacon Hales of the Art History Department of the University of Illinois at Chicago outlines this remarkable history—the "democratization of prosperity" if you like.

The truly remarkable Levitts supplied new starter homes for $US8,000 to single-earner  young families (yes....single-earner) earning an average of just $US3,800 a year—that means starter homes selling at just 2.1 times annual household earnings, with a mortgage load of only 18% of the family’s annual gross income!

Our young people today deserve these same opportunities. Buying a house should be as easy as buying a car (although the former is of course more expensive and financed over a longer period).

The major reason this was allowed in Levittown—because even then in the States planners were out there arguing against what the Levitts were doing—was because the Authorities in the end were too frightened to deny affordable housing to soldiers returning from World War Two. They didn't want a repeat of the civil unrest that occurred with returning veterans following World War One, which in Europe helped usher in Mussolini and worse. Indeed, when politicians and planners got in the road, Levitt often called the Veterans Association in for support.

You would think there would be abundant political pressure around Christchurch to similarly focus attention!

ON THE FRONT PAGE of my archival website www.PerformanceUrbanPlanning.org I offer a clear definition of an Affordable Housing Market:

DEFINITION OF AN AFFORDABLE HOUSING MARKET
For metropolitan areas to rate as 'affordable' and ensure that housing bubbles are not triggered, housing prices should not exceed three times gross annual household earnings. To allow this to occur, new starter housing of an acceptable quality to the purchasers, with associated commercial and industrial development, must be allowed to be provided on the urban fringes at 2.5 times the gross annual median household income of that urban market (refer
Demographia Survey Schedules for guidance).
The critically important Development Ratios for this new fringe starter housing, should be 17 - 23% serviced lot section cost, with the balance being the actual housing construction cost.
Ideally, to ensure maximum stability and optimal medium and long term performance of the residential construction sector through a normal building cycle, the Median Multiple should move from a Floor Multiple of 2.3, through a Swing Multiple of 2.5 to a Ceiling Multiple of 2.7.

So even with the commendable numbers at which the Canterbury Cooperative Land Trust is offering these sections—and I do applaud them for what they are trying to do—we are still a million miles from where fringe sections should be priced.

Recovery Minister Hon Gerry Brownlee is well aware of all this too, as he chaired Parliament’s Commerce Committee Inquiry into Affordable Housing Inquiry back through 2007/08.

He knows it, but he’s not prepared to do anything about it.

Hugh Pavletich
Coordinator, Cantabrians Unite

Wednesday, 23 April 2014

New Zealand’s Bubble Economy Is Vulnerable [updated]

Guest post by Hugh Pavletich

The recent Forbes e-edition article by Jesse Colombo assessing the New Zealand economy, “12 Reasons Why New Zealand's Economic Bubble Will End In Disaster” (about which we blogged here yesterday) seems to have created quite a stir, creating extensive media coverage in New Zealand.

One article alone, Michael Field’s major Fairfax article ‘NZ bubble 'going to burst', stimulated a remarkable 500+ comments.

It didn’t take too long for the politicians to react, with Acting Finance Minister Steven Joyce downplaying it, unhelpfully personally attacking Mr Colombo, with Labour’s David Cunliffe and David Parker largely agreeing with Mr Colombo’s assessment.

But then, they would all say that, wouldn’t they.

Mr Colombo’s initial assessment (a comprehensive report is to follow) was from a financial expert’s perspective, and rested largely on New Zealand’s level and fragility of mortage debt, and local banks’ exposure to it.

Let’s consider, looking specifically at housing affordability, whether Mr Colombo is correct from a structural perspective.

Monday, 21 January 2013

Auckland is the world’s ninth-least affordable city in which to buy a house

The 2013 9th Annual Demographia International Housing Affordability Survey has just been released (here’s the link to download a PDF copy), showing all New Zealand’s major housing markets (and more than 60 percent
of all our housing) remain “severely unaffordable”—and this situation is getting worse, not better.

Auckland continues to ranks as the world’s ninth-least affordable city in which to buy a house.

The survey covers 337 urban markets of the United States (216); United Kingdom (33); Canada (35); Australia (39); New Zealand (8); Ireland (5) and Hong Kong (China). A supplemental analysis of Singapore is also incorporated within the Survey.

The Survey is based on the “Median Multiple” – where the median house price is divided by the gross annual median household income.  In affordable and normal housing markets, house prices do not exceed 3.0 times annual household incomes.  If they do exceed this standard, it indicates that there are political and regulatory impediments to the supply of new housing that need to be dealt with (further research required on dense high rise urban environments such as Singapore and Hong Kong, to ascertain the affordability ceiling).

image

Houses in New Zealand are now nearly 80 percent more expensive than the historic affordability housing norm of 3.0, last experienced in the 1990s.

Auckland was the least affordable market, with a Median Multiple of 6.7. Along with Auckland, Christchurch
(6.6), Tauranga-Western Bay of Plenty (5.9), Wellington (5.4) and Dunedin (5.1) were severely unaffordable.

Three New Zealand markets were seriously unaffordable, Palmerston North (4.4), Napier-Hastings (4.5) and
Hamilton (4.7). New Zealand had no affordable markets and no moderately unaffordable markets (Table 10).

image

There is no mystery about the supply of affordable new housing and a simple structural definition of an affordable housing market is provided within the Survey.  Detailed analysis and commentary is provided on each of the countries surveyed – with a focus on individual urban markets – their trends and political developments. Information on important international research is also provided.

The Introduction to this year’s Survey is contributed by the Deputy Prime Minister of New Zealand Bill English.  Mr English explains why the New Zealand Government is committed to restoring affordable housing in New Zealand – and is focused on the four structural impediments – being –

  • Land supply
  • Infrastructure
  • Process
  • Construction costs

A recent New Zealand Television One Colmar Brunton Poll found that 62% of all and 75% of young (18 – 35) New Zealanders are demanding the Government allow affordable housing be provided.

Unfortunately, what Little Bill English proposes by way of improving affordability is much too little, far too late, and unlikely to make any impact whatsoever. And I suspect the Demographia team know that…

Thursday, 13 October 2016

Nick Smith & Phil Twyford are both right, and both very wrong


The major party’s various spokesthings have all been arguing through the media over how many “affordable” homes have been built in the last three years, yet none have bothered to ask whether that tag in the context over which they’re arguing means anything.

The story first. Looking for a headline, Labour’s Phil Twyford “released official Auckland Council figures that showed in the past three years, only 18 houses built on special housing areas were declared to be an affordable dwelling.” Which sounds damning. In response, “Housing Minister Nick Smith said more than 500 homes from two special housing sites have been completed and cost under $650,000” – 190 homes at Weymouth, and 327 at Hobsonsville. Which sounds better.

But which one’s right? And does it actually matter?

Well, they’re both right, because they’re both talking about different things – one about houses for which a “statutory declaration” of being affordable has been made as part of a so-called Special Housing Area (SHA) developement, the other about houses in the SHAs a cabinet minister might call affordable.

But does it matter?

Well, let’s ask the Prime Minister who, in 2007, said

I think it’s dangerous for the Government to pretend that developments such as that [government-promoted scheme] at Hobsonville are some sort of panacea to the housing affordability crisis…

And he was right. Still is. Because as he went on to say, “Well, let’s get real here.” Which is to say, if we’re to speak with the bark off, either 18 or 500 – that’s a drop in the fricking bucket compared to the thousands of houses needed to break the ever-spiralling cycle upwards! The only solution, as the Prime Minister understood in those halcyon days before he actually took office and became a wind-up Smile-and-Wave Doll, “If we want to make houses more affordable for first-home buyers, we need more houses to be built as cost-effectively as possible.”

Which, to be blunt, means him and his cronies getting the fuck out of the way.

If they did, we wouldn’t need to be arguing about how many houses with the government label “affordable” on them had been built, because builders would be able to get out there and build by the thousand the houses that would make the overheated market actually affordable again.

They wouldn’t need to build them on Special Housing Areas or make goddamn “statutory declarations” about how many alleged affordable units were in each development if both the RMA and the Building Act were properly euthanased. Instead, we could simply rely on the ability for builders to make a fair profit on their spec houses and the age-old mechanism of “churn” – the housing version of The Double-Thank You Moment.

Churn?

“Churn” in this context refers to the chain of purchasers who “trade up” after a new house is bought and folk move into that house and out of their old one—leaving their old house empty for someone else to move into, which leaves their house empty for someone else to move into, which leaves their house empty for someone else to move into, and so on and so on right on down the line.

In a healthy housing market, one house purchase by one family can start off a chain reaction of up to ten, twelve or even twenty moves further down the line as each family moves out of their old and up to their new home.

Why do I say “move up”? Because this is the housing equivalent of the weird double-thank-you moment we talk about in economics:

How many times have you paid $1 for a cup of coffee and after the clerk said, "thank you," you responded, "thank you"?
There’s a wealth of economics wisdom in the weird double thank-you moment. Why does it happen? Because you want the coffee more than the buck, and the store wants the buck more than the coffee. Both of you win.

Equally, when you decide to sell what you’ve got now to move into a new place, it’s because you want the new place more than the old place—and your new buyer wants your old place more than their old place, and so on down the chain. You each want the new place because in your minds your new housing situation is going to be better for you than your existing housing situation.

It’s just the same for every buyer in the chain.

So every time a new house is built and purchased, of whatever value, that opens up opportunity for many other families to make their situation better. 

So while the buyer of the $300,000 may not know it, that new $485,000 house is what just made his own life better. He’s at the end of a chain of churn created by that first purchaser and his vendor saying “Thank you!”

This is what happens when the housing market is not broken by regulation, as it is now.NewHome001

Here’s something else that seems contradictory until you think it through a little: It turns out too that in a healthy housing market a new more expensive home creates more openings down the line than a cheaper more affordable home does—up to twenty housing moves for an upper-quartile home as compared to less than five or six for one in the lower price quartile--meaning, strangely enough, that the more expensive houses that are built the more folk actually benefit.*

If that idea makes your head hurt, then consider this question: is it better in general to build better houses or lesser houses? Wouldn’t we all agree that better quality is far better than lesser? So as better houses costing more are built and folk move up to what in their own view are better houses, the overall housing stock for everybody is improved.NewHome002

Isn’t this better than flooding the market with houses of lower cost and lesser quality, which actually produces fewer moves helping fewer people, and resulting in the end only in having created the slums of tomorrow?

The real answer to affordable housing then has been provided neither by the Blue Team nor the Red Team.

The answer is to fix the broken market.

And how do they do that?  They stop pretending they know what they're doing and just get the hell out of the way.

..

Tuesday, 25 January 2011

Houses getting less and less affordable despite the bursting bubble

Despite New Zealand’s parlous economic conditions, New Zealand housing is no more affordable now than it was before the economic wheels started falling off. In fact, according to the latest annual Demographia International Housing Affordability Survey housing in New Zealand is still severely unaffordable.

Author Joel Kotkin notes that even after the bursting of the housing bubble, the ratio of incomes to housing prices in most cities (what the researchers call “the median multiple”) has shown a steady increase.

_Quote The survey gave New Zealand a median multiple of 5.3 for housing affordability, which is above the historic norm of three.
    All major [cities] in Australia and New Zealand, as well as Hong Kong, were judged to be severely unaffordable. Of the 325 [cities] the survey covered, 115 were affordable, 94 were moderately unaffordable, 42 were seriously unaffordable and 74 were severely unaffordable.
    All of the affordable [cities] are in the United States. The most affordable  is Atlanta, with a median house price of $US129,400 ($NZ170,485). Hong Kong was the least affordable major [city], with a median multiple of 11.4, Sydney second with a median multiple of 9.6 and Vancouver was 9.5.
    New Zealand's housing was [rated as] affordable in the early 1990s, with a median multiple of under three, the survey said.
    Auckland now has a median multiple of 6.4, with Christchurch on six and Wellington on 5.5, which is regarded as severely unaffordable. Tauranga-Western Bay of Plenty was again the least affordable market [in the country], with a median multiple of 6.5.

The reason some cities’ houses remain severely unaffordable while others do not (median house price of just $US129,400 in Atlanta!) remain the same, and may be described very simply: cities in which town planners have been given powers to seriously restrict house-building are generally the least affordable; those in which they have the least power are generally the most affordable.

In other words, the more “sustainable” a city is and the more power its “planners” have, the less affordable its housing.

Now you might have thought that Prime Minister John Boy might have been working since his election to turn around the dire situation in which even hard-working New Zealanders are finding it increasingly difficult to buy a house. But you’d be wrong. Instead, Smile and Wave’s local government minister Rodney Hide just spent the last two years working night and day not to remove power from the smug self-anointed vermin who have made life worse for would-be home-owners, but instead (as a model for councils across the country) to give Auckland’s town planners even more power to make the city even more severely unaffordable.

What a creep. What a disgrace. What a tragedy.

NB: You can download the detailed survey and related commentary at the Demographia website, from whence graphs and tables like these two below are sourced.

Unaffordable

RELATED POSTS: