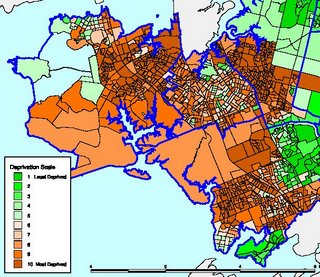
 A friend sent me this map (left) of the area in which I grew up. (If you look hard, you can see Phillip Field's office.) According to the map it's all dark brown. How 'bout that.
This you see, is what use is made of all those census statistics you lot filled out so obediently last year -- they're used by sociologists to produce maps like this: 'The New Zealand Index of Deprivation.' Dark brown means "most deprived." Bright green means "least deprived." The criteria for these measures were chosen by the sociologists who produced the study, as were the colours. Perhaps some of those sociologists have a sense of humour?
Maybe they do. What they don't have however is a broad range of views within their profession -- and who would be surprised about that? In fact, a new study on sociologists themselves (those expensive exercises normally conducted by sociologists) found very little diversity of views among the 'profession.'
In fact, surprise, surprise, the study "found far more support for economic regulations, the regulation of personal choices, and a broad role for government than opposition to them." In other words, they're all slavering state-worshippers.
Daniel B. Klein and Charlotta Stern, the authors of the study ("Sociology and Classical Liberalism," THE INDEPENDENT REVIEW, Summer 2006), sent letters to 1000 members of the American Sociological Association asking their preferences about 18 public-policy topics. The 347 responses they received suggest that the sociology profession in the United States tilts heavily to the left and has few, in any, classical liberals.No suprise at all. No surprise then that all such sociological studies as 'The New Zealand Index of Deprivation' is used simply to justify even more state intervention in areas where atate intevention has already caused more than enough problems.
LINK: Sociology and classical liberalism - The Independent Review
RELATED: Politics-NZ, Auckland, Politics, Welfare, Racism
1 comment:
What clown uses brown and green for colour coding anyway? It's virutally impossible to decipher if you're colour-blind!
Post a Comment