David Stockman summarises the results of 15 years of Keynesian stimulus in the U.S. …
At this point 15 years ought to count for something. After all, we have now used up one-seventh of this century. So you can’t say its too early to tell what’s going on or to identify the underlying trends.
Indeed, during that span we have encompassed several business cycles, two financial crises/meltdowns and nearly a non-stop blitz of “extraordinary” policy interventions. To wit, a $700 billion TARP, an $800 billion fiscal stimulus, upwards of $4.0 trillion of money printing and 165 months out of 180 months in which interests rates were being cut or held at rock bottom levels.
You’d think with all that help from Washington that American capitalism would be booming with prosperity. No it’s not. On the measures which count when it comes to sustainable growth and real wealth creation, the trends are slipping backwards—– not leaping higher.
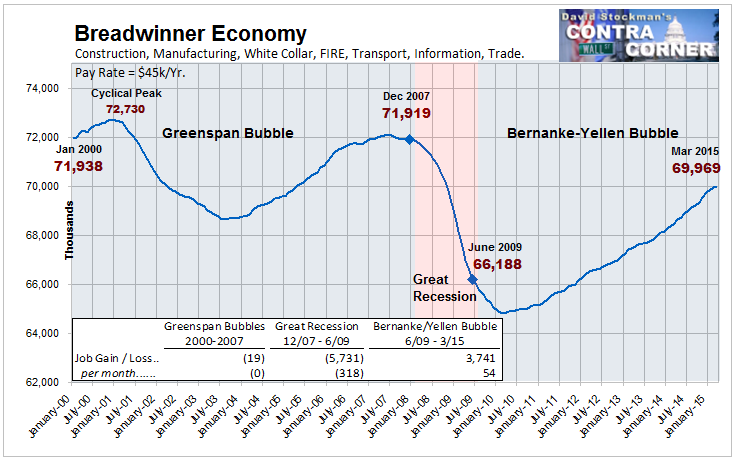
So here’s the tally after another “Jobs Friday.” The number of breadwinner jobs in the US economy is still 2 million below where it was when Bill Clinton still had his hands on matters in the Oval Office. Since then we have had two Presidents boasting about how many millions of jobs the have created and three Fed chairman taking bows for deftly guiding the US economy toward the nirvana of “full employment”.
Say what?
Breadwinner Economy Jobs – Click to enlarge
When you look under the bonnet it’s actually worse. These “breadwinner jobs” are important because its the only sector of the payroll employment report where jobs generate enough annual wage income—about $50k—- to actually support a family without public assistance.
Moreover, within the 70 million ‘'”breadwinner jobs” category, the highest-paying jobs which add the most to national productivity and growth——goods production—-have slipped backwards even more dramatically. As shown below, there were actually 21% fewer payroll jobs in manufacturing, construction and mining/energy production reported last Friday than existed in early 2000.
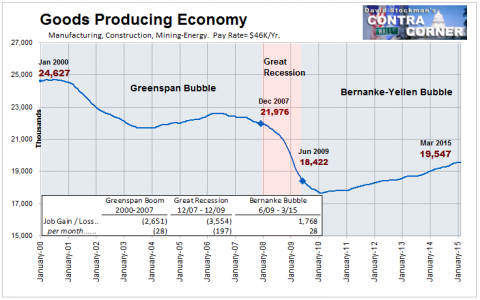
Goods Producing Jobs – Click to enlargeThen take the matter of productivity growth. If you don’t have it, then incomes and living standard gains become a matter of brute labour hours thrown against the economy. In theory, of course, all the business cycle boosting and fine-tuning from fiscal and monetary policy, especially since the September 2008 crisis, should be lifting the actual GDP closer to its “potential” path, and thereby generating a robust rate of measured productivity growth.
Not so. Despite massive policy stimulus since the late 2007 peak, nonfinancial business productivity has grown at just 1.1% per annum. That is just half the 2.2% annual gain from 1953 until 2000. So Washington engineered demand stimulus is self-evidently not pulling up productivity by its bootstraps.
Indeed, if you go back to the 1953-1973 peak-to-peak period, which also encompassed several business cycles, the annual productivity growth rate averaged 2.7% or two and one-half times the last 15 year outcome.
But here’s the thing. That sterling result occurred during those allegedly benighted times under Eisenhower, who believed in balance budgets, not Keynesian stimulus, and delivered several of them. It also encompassed the “new economics” era of the Kennedy-Johnson Keynesians, who dismissed a calendar-bound balanced budget approach, but to their credit did believe in balanced budgets over the business cycle. And they made good on that theory by getting LBJ to raise taxes and cut spending when the guns and butter economy got over-heated in 1968.
And most importantly, it was also the time of the “light touch” monetary policies of William McChesney Martin who presided at the Fed during most of this period. Unlike the Bernanke/Yellen Fed that still can’t gets its hand off the stimulus button 70 months after the Great Recession ended, Martin once took the “bunch bowl” away only 4 months after a business recovery commenced because he believed his job was done. Growth was up to capitalism, not the Fed’s FOMC.
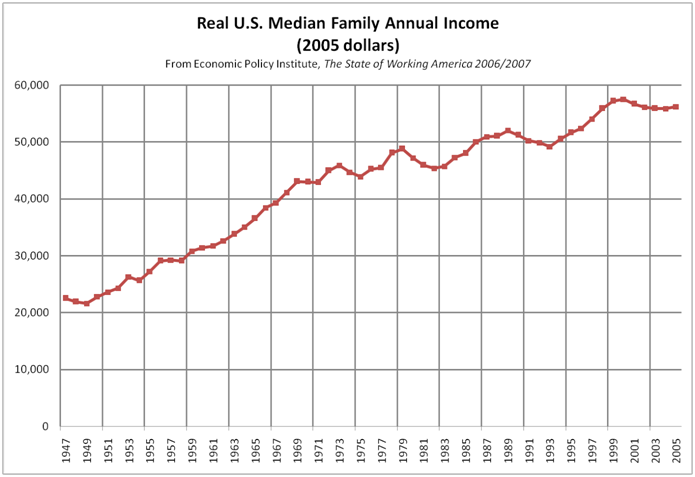
The same picture occurs on real median household income. During the earlier 1953-1973 interval, real median family income grew at 3.0% annually, rising from $26k to $46k during the period.
By contrast, over the course of the next 27 years, and after Washington ended both the Bretton Woods gold standard anchor on money and the practice of balanced budgets, real median incomes grew by only 0.8%annually, rising to just $57k by the year 2000.
Needless to say, its been all downhill since then. Real median income was down to $53k in 2014. That means median living standards of US households have been falling at a 0.5% annual rate since the turn of the century. There is no prior 15 year period that bad, including the years after the 1929 crash.
The argument of the Keynesians is that capitalism is a chronic underperformer. Left to its own devices, they say, it is always leaving idle labour and capital resources on the table, and is even prone to bouts of depressionary collapse absent the counter-cyclical ministrations of the state and its central banking branch.
Well, then, given the monumental size and chronic intensity of policy stimulus during the last 15 years, that particular disability should have been eliminated long ago. The US economy should be surfing near its full potential.
In that regard, one measure of high resource utilisation most surely would be the labour-force participation rate. As shown below, however, after the one-time boost of increased female participation after 1980, the trend has been in a nose-dive…

Read more: 15 Years Of Stimulus—–Nothing To Show – David Stockman, CONTRA CORNER
RELATED READING:
- More Bad News for the Keynesian Multiplier – Peter Klein, MISES.ORG
A new paper by Price Fishback and Valentina Kachanovska in the prestigious Journal of Economic History provides new evidence on the effect of US federal spending on state-level income and employment during the Great Depression. Fishback (a former student of Robert Higgs) and Kachanovska, estimate state-level multipliers of between 0.4 and 0.96 -- in other words, a dollar of federal spending crowded out from 4 to 60 cents of private investment….
No comments:
Post a Comment