 How do you tell the difference between an investment and a hole in the ground? It's not always as as easy as you might think.
When prices of widgets or wodgets are going up and up and up, it's easy to think that widgets or wodgets -- or tulip bulbs, or llamas, or ostriches -- or houses -- represent a real investment, and not just something whose returns are based solely on the number of 'investors' stampeding into the market desperate to make 'capital gains.'
The 'capital gains' for these 'bubble commodities' are real enough, at least at first, but the cause of rising prices is frequently nothing other than the same thing that drives your friendly, neighbourhood pyramid scheme: new people with new money coming on board all the time. So too is the cause of the eventual collapse the same: no new people, no new money, and a slow realisation that the market has been inflated beyond all reason -- that the reason for the gains was illusory.
 The chart for the seventeenth century Tulip Bulb Mania (right) stands for all such bubbles -- a brief inflationary bubble that literally feeds upon itself, followed by rapid collapse as early 'investors' leave the scheme, only to see the pyramid/bubble collapse and prices go back to a level based on fundamentals rather than flatulence.
The same thing happened with the South Seas Bubble in the eighteenth century, the Railway Mania in the nineteenth, the Florida Land Bubble in the 1920s, the Japanese Asset Bubble in the 80s, the Dot.Com Bubble in the 90s ... and now the Housing Bubble of the 2000s, the one that we're all now paying for.
You see, real resource are used up in these false 'booms' -- real resources that are bid away from genuinely productive businesses into sectors that are considered (at the time) to be sexier, and more profitable. Sometimes there's a real reason underlying price gains -- increased profits from railway companies; restrictions on land supply imposed by governments - but the bubble builds on the back of these initial gains and leverages them into something insane, whose returns are measured only by the new money coming into the market.
You might have noticed that bubble behaviour in the last century has been more frequent and more virulent: US Fed chairman Ben Bernanke's favourite technology, the printing press. Said Bernanke in 2002, when his then boss Alal Greenspan was inflating his way out of the collapse of the Dot.Com bubble and sowing the seeds for the collapse of the housing bubble:
The US government has a technology, called a printing press (or, today, its electronic equivalent), that allows it to produce as many U.S. dollars as it wishes at essentially no cost... under a paper-money system, a determined government can always generate higher spending and hence positive inflation.
[5].jpg?imgmax=800) "Positive inflation." Central banks and their printing presses, and the "positive inflation" of their bubbles, are in all important respects a twentieth-century invention. Every time the central banks inflate the money supply, we see a boom. An inflationary boom, followed by a bust. This time it happened in housing, and everyone thought they were making a million dollars. Alan Greenspan's inflation of the money supply from 2001 to 2004 (right) underpinned the housing bubble that is only just starting to burst here and elsewhere.
"Positive inflation." Central banks and their printing presses, and the "positive inflation" of their bubbles, are in all important respects a twentieth-century invention. Every time the central banks inflate the money supply, we see a boom. An inflationary boom, followed by a bust. This time it happened in housing, and everyone thought they were making a million dollars. Alan Greenspan's inflation of the money supply from 2001 to 2004 (right) underpinned the housing bubble that is only just starting to burst here and elsewhere.
 When you look at charts of the US housing market (right) you can easily see the bubble and its correlation with Greenspan's inflationary injection.
Notice [says the bubble watcher from whom I pinched that graph] that in the 25-year period from 1975 through 1999, real house prices stayed roughly within the range of $132,000 to $171,000. Only since the year 2000 have real house prices risen above the top of this range. The United States median price was at approximately $206,500 as of the second quarter of 2008. This is 21% higher than the previous housing boom peak of an inflation-adjusted $170,900 in 1989.
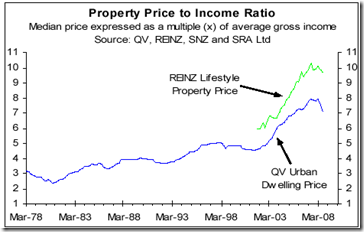 The NZ housing market performed the same way, based on our own Reserve Bank's inflationary credit creation, as this chart (right) from Rodney Dickens latest 'Raving' demonstrates.
In both markets, relative stability over recent decades erupted into a credit-fuelled bubble that can only collapse once the air is taken out.
Gareth Morgan reckons the drop in prices will be something like thirty percent. Study those graphs and you'll see why.
And if you want to know where all the money has gone, to understand what happens when central banks use Ben Bernanke's favourite technology to "generate higher spending and hence positive inflation," study your credit card statements to see how you've been using the "investment" in your home to consume your capital. Take a look at the empty subdivisions and unsold or uncompleted developments around the likes of Orewa, Omokoroa, Tutukaka, Mangahawai, Raglan, and other 'boom' areas in recent years. Inflationary credit creation has bid resources away from genuinely profitable work, and into malinvestments such as these whose replacement cost (over-inflated by regulation) is now higher than their price that buyers are willing to pay.
Such is the inevitable result of resorting to the printing press to fake economic reality.
FURTHER READING:
UPDATE: Jean-Paul Rodrigue at NY's Hofstra Uni has a chart that describes all bubbles over time:
2 comments:
I've been arguing with people about this for years. Why would you buy an "investment" property that is only returning you 3% in rental? There is no way capital gains can be sustained with those sorts of margins.
Another interesting graphical model of the situation is seen here: http://www.rbnz.govt.nz/keygraphs/Fig4.html
$400 billion would be a decent estimate of where we would be had house values risen in a similar linear fashion to the 90's. That means, like Gareth Morgan says, we're looking at about a 30% drop from 'peak value'.
Lots of people who have purchased in the last few years will be looking down the unpleasant barrel of the negative equity gun. For those who got out in the last couple of years. Well done! Investment is all about knowledge, timing (and maybe a little luck).
PC...for the nth time the RBNZ does not create credit, the private banks do.
The RBNZ acts on the CPI not M3 (unfortunately).
It is the banks, specifically investment banks, that have led the charge in leveraging the system.
Post a Comment