Well, of course that's correct. But it's still a bloody cold summer -- the coldest in sixty years or so.
And isn't it true that the warmists are still chattering about 1998 being "the warmest year ever" (which it wan't, by the way, and after which temperatures have all been downhill)? But wasn't that also due to El Nino -- indeed, the "strongest El Nino on record"? Does that mean the warmists will stop chattering about that now? Any chance at all?
And just for your interest, here's a graph below from the Global Historical Climatology Network dataset for NZ's latitude and longitude (unlike NIWA, GCHN has no political axe to grind) so you can see for yourself the "general warming trend in NZ" that Frogblog is talking about. Does 0.02 degrees/decade sound catastrophic to you?
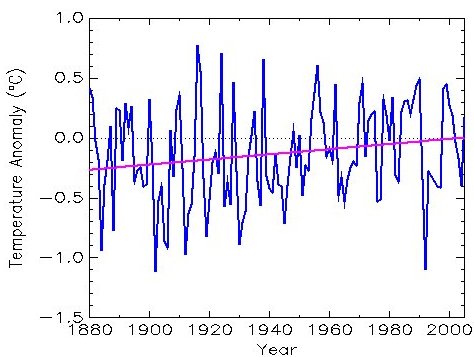
Latitude Range -90 to -60, Longitude Range 165 to 180
(from the Global Historical Climatology Network dataset)
And if you want to generate your own graphs from your choice of datasets from various sources, from balloons to satellites to land-based stations, then CO2 Science is probably the place to go.
LINKS: El Nino in NZ - Frogblog (Green Party)
There IS a problem with global warming... it stopped in 1988 - Bob Carter, Telegraph (UK)
Links to dataset descriptions - CO2 Science
RELATED: Global Warming
6 comments:
PC said...
[...here's a graph below from the Global Historical Climatology Network dataset for NZ's latitude and longitude...]
Just a note that the widely adopted method for long term forecast by using straight line (simple linear regression) shown in that graph is an inappropriate method and highly misleading. This simple linear regression of time-series is very common in climate data analysis. The reason that simple linear regression is inappropriate because time series involve in climate data analysis are highly stochastic & non-stationary. Non-stationary means that the time-series pattern does not show any sign of periodic regularity at all, but random fluctuations.
The proper methods used in advance time-series analysis are adopted from the domain of signal processing. All time series are composed of different frequency components where they have been super-imposed on each other resulting in the overall time series that is observed.
The signal processing methods that are popular for finding out the long-term trend (straight-line) of a time-series are any of the high-frequency digital filter algorithms which there are a number of variants, such as Butterworth or Chebyshev. All the high frequency components are filtered out thus leaving the lowest component which corresponds to the long-term trend, which is not necessary a straight line. This long-term trend line can thus reveal a trend-up or trend-down.
If you ever hear a climate expert whether from NIWA or anywhere else telling you about temperature trending up over the last 100 years or so, just ask him a quick question about his method of analysis. If he/she says 'simple linear regression', just tell that person to go and kiss Al Gore's bottom.
Does 0.02 degrees/decade sound catastrophic to you?
No, not really. You know I don't think I'll bother being alarmed by 0.02 degrees per decade. i think I'll just sit back and not try to fix the problem as there is none to fix. I don't waste time trying to fix non-existent problems. it just cant be done no matter how hard you try.
CLimate Audit had some interesting graphs about temerature above sea surfaces and the use of linear measurement techniques.
www.climateaudit.org/?p=1100#more-1100
Anon said ...
[CLimate Audit ... use of linear measurement techniques.]
I have had about 4 email exchanges with Steve McIntyre who runs that web site (Mr. McIntyre discredited the hockey stick).
Yes , he agreed that linear method is misleading. I also suggested to him some techniques & algorithms that are new to him, considering that he is a statisticians. One of those techniques in time-series analysis I suggested to him was 'wavelets'. The other one that I pointed out to him was the non-linear version of the standard PCA (principal component analysis) called kernel PCA (or kPCA). PCA was used in the hockey-stick by Michael Mann, which was discredited by Mr.McIntyre. Standard PCA is a linear method, which is inferior to nonlinear ones as kPCA because climate data is non-linear & not linear.
Try this...
Take a large container and throw in a layer of ice. Now put a lid on the container and place the whole thing on the front lawn and in the sun.
What will happen to the temperature inside the bin?
Not a hell of a lot, because the ice inside the container will absorb most of the energy from the sun, melting the ice in the process. Over time the rate at which the ice melts will increase and only once all the ice has melted will you observe significant increases in temperature.
What does this tell us kids...?
That's right, measuring global temperatures by themselves is irrelevant.
Anon said...
[That's right, measuring global temperatures by themselves is irrelevant.]
Hello Anonymous kid. Are you talking about the interpretation of the physical measurements or the theory of causation in physics. I suggest you read my post on the thread:
"New report says global warming is negligible, short-lived, and now ended" - Dr Vincent Gray"
and that is exactly what I briefly stated in that post of what is called MIMO systems (Multiple Input - Multiple Output). Global temperature can be one of those many output variables to be measured. MIMO is stated here, see link below, but it is not so detail. If you want detail of what MIMO dynamical systems is, just post back here kid, so that the teacher (myself) will quote you appropriate publications so that you can dig in deep & learn in order for you to understand "evolving dynamical systems"
"Control Theory"
http://en.wikipedia.org/wiki/Control_theory
Ok, that's all for our lesson today class & Anonymous kid, and always remember to do your homework for tommorow, complete it before watching your kid's show "The Simpsons".
Post a Comment